Category: Stock News

  • Growth Investing in India: A Comprehensive Guide for Retail Investors

    Growth Investing in India: A Comprehensive Guide for Retail Investors

    Introduction to Growth Investing

    Growth investing is a popular approach among Indian retail investors who seek to benefit from the long-term appreciation of companies with strong potential for expansion. In the context of the Indian stock market, which includes the National Stock Exchange (NSE) and Bombay Stock Exchange (BSE), growth investing involves identifying companies expected to deliver above-average earnings or revenue growth compared to their peers or the broader market.

    What is Growth Investing?

    Growth investing is a strategy where investors focus on companies that are expected to grow at a faster rate than the overall market. These companies typically reinvest their profits to expand operations, develop new products, or enter new markets, rather than paying high dividends. The primary goal is capital appreciation, meaning the value of the investment increases over time as the company grows.

    Key Characteristics of Growth Stocks

    • High Revenue and Earnings Growth: Growth companies often report strong year-on-year increases in sales and profits.
    • Reinvestment of Profits: Instead of distributing large dividends, these companies usually reinvest earnings to fuel further growth.
    • Innovative Products or Services: Many growth companies operate in sectors like technology, pharmaceuticals, or consumer goods, where innovation drives expansion.
    • Premium Valuations: Growth stocks often trade at higher price-to-earnings (P/E) or price-to-book (P/B) ratios compared to the market average, reflecting investor expectations of future growth.

    How to Identify Growth Stocks in India

    Identifying growth stocks in the Indian market requires a combination of quantitative analysis and qualitative assessment. Here are some common steps:

    1. Analyse Financial Statements

    Look for companies with consistently rising revenues and profits over several years. For example, a company listed on NSE or BSE showing double-digit annual sales growth over the past five years may be considered a potential growth stock.

    2. Examine Industry Trends

    Growth companies often operate in expanding industries. For instance, sectors like information technology, e-commerce, renewable energy, and pharmaceuticals have shown significant growth in India in recent years.

    3. Assess Management Quality

    Strong leadership and a clear vision are crucial for sustained growth. Review the company’s management track record, strategic decisions, and ability to adapt to changing market conditions.

    4. Evaluate Valuation Metrics

    Growth stocks may have high P/E or P/B ratios. Compare these metrics with industry peers to understand if the premium is justified by the company’s growth prospects.

    5. Consider Market Share and Competitive Advantage

    Companies that are increasing their market share or have a unique competitive advantage (such as proprietary technology or strong brand recognition) are often good growth candidates.

    Growth Investing vs Value Investing

    Growth investing and value investing are two distinct approaches. Here’s how they differ:

    Aspect Growth Investing Value Investing
    Focus Companies with high growth potential Companies trading below intrinsic value
    Valuation Often high P/E, P/B ratios Low P/E, P/B ratios
    Dividends Usually low or no dividends May offer higher dividends
    Risk Profile Higher risk, higher potential reward Lower risk, focus on margin of safety

    Risks Associated with Growth Investing

    While growth investing can be rewarding, it also comes with certain risks:

    • Valuation Risk: Paying too much for expected growth can lead to losses if the company fails to deliver.
    • Market Volatility: Growth stocks tend to be more volatile, especially during market corrections.
    • Execution Risk: Companies may not achieve projected growth due to competition, regulatory changes, or operational challenges.
    • Sector Concentration: Growth investors may end up with portfolios concentrated in a few high-growth sectors, increasing overall risk.

    Example: Understanding Risk in Growth Stocks

    Suppose an investor buys shares of a technology company listed on the NSE, expecting rapid expansion into new markets. If the company faces unexpected regulatory hurdles or increased competition, its growth may slow down, causing the share price to fall.

    Regulatory and Tax Considerations

    Investing in Indian equities is regulated by the Securities and Exchange Board of India (SEBI), which ensures transparency and investor protection. Retail investors should be aware of certain regulatory and tax aspects:

    SEBI Regulations

    SEBI sets rules for disclosures, insider trading, and corporate governance. It is important to invest in companies that comply with SEBI regulations. Investors can access company filings and announcements on the NSE and BSE websites.

    Taxation of Capital Gains

    Profits from selling shares are subject to capital gains tax in India. As of the time of writing, short-term capital gains (for shares held less than 12 months) are taxed at a higher rate than long-term capital gains (for shares held longer than 12 months). However, tax rules may change, and investors should check the latest provisions or consult a qualified tax advisor. [Manual fact check required: Confirm current capital gains tax rates and holding period definitions]

    Dividend Taxation

    Dividends received from Indian companies are also taxable in the hands of the investor. The applicable tax rate can depend on the investor’s income tax slab. [Manual fact check required: Confirm latest dividend taxation rules]

    Educational Example: Analysing a Hypothetical Growth Stock

    Let’s say there is a company, ABC Technologies Ltd, listed on the NSE. Over the past five years, it has reported:

    • Annual revenue growth of 18%
    • Consistent profit margin improvement
    • Significant investment in research and development
    • Expansion into new domestic and international markets

    Despite trading at a higher P/E ratio than its peers, ABC Technologies Ltd continues to attract investor interest due to its growth trajectory. However, if the company fails to sustain this growth, its stock price could be affected.

    Best Practices for Growth Investors

    • Diversify: Avoid concentrating your portfolio in a single sector or company.
    • Monitor Performance: Regularly review company performance and industry trends.
    • Understand Risks: Be aware of the volatility and potential for losses.
    • Stay Informed: Follow SEBI, NSE, and BSE updates for regulatory changes.

    Conclusion

    Growth investing in India offers opportunities for investors willing to research and understand the dynamics of fast-growing companies. While the potential rewards can be significant, it is important to recognise the risks and regulatory factors involved. By staying informed and adopting a disciplined approach, retail investors can participate in India’s growth story through the stock market.

    Frequently Asked Questions (FAQs)

    • Q: What is the main objective of growth investing?
      A: The main objective is capital appreciation by investing in companies with strong earnings or revenue growth potential.
    • Q: Are growth stocks riskier than value stocks?
      A: Growth stocks can be more volatile and may carry higher risk due to their premium valuations and reliance on future performance.
    • Q: How can I identify growth stocks in India?
      A: Look for companies with consistent revenue and profit growth, strong management, and a competitive advantage in expanding industries.
    • Q: What are the tax implications of growth investing?
      A: Profits from selling shares are subject to capital gains tax, and dividends are taxable. Tax rules may change, so consult the latest official sources or a tax advisor. [Manual fact check required]
    • Q: Does SEBI regulate growth investing strategies?
      A: SEBI regulates the overall securities market and investor protection, but does not prescribe specific investment strategies.

  • Market Activity; CG Power and Industrial Solutions Ltd Shares Rise 7%

    Market Activity; CG Power and Industrial Solutions Ltd Shares Rise 7%

    Mumbai, May 29: CG Power and Industrial Solutions Ltd shares were trading higher at ₹937.00 on NSE as of 9:07 AM IST on May 29, 2026, even as No immediate company-specific announcement was available on NSE/BSE at the time of writing. The CGPOWER counter was up 7.00% compared with the previous close of ₹879.15, and market activity was firm in early trade.

    The stock has already moved through a wide band so far in the session, with the high so far matching the day’s peak at ₹938.90 and the low so far placed at ₹882.00.

    CG Power and Industrial Solutions Ltd Share Price Movement

    CG Power and Industrial Solutions Ltd shares were trading at ₹937.00 on NSE as of 9:07 AM IST on May 29, 2026, compared with the previous close of ₹879.15. The counter opened at ₹938.90, which was also the high so far, while the low so far stood at ₹882.00 during day’s trade.

    That leaves the CG Power and Industrial Solutions Ltd share price close to the session peak, after an early range that has already covered more than ₹56 from the low to the high. Trading volumes stood at 92,58,467 shares, compared with average volume of 38,36,556 shares, putting relative volume at 2.41.

    The stock has therefore seen heavier than usual market activity in the first part of the session, even without any fresh company disclosure to anchor the move. The company’s market capitalisation stood at ₹1,46,785.99 crore, while the share count was 62,67,50,016. On valuation markers supplied with the market data, the PE ratio was 121.94 and EPS was 7.7.

    Recent CG Power and Industrial Solutions Ltd Stock Performance

    The latest move leaves the counter at its 52-week high of ₹938.90, with the stock trading 0.00% below that level at the time of writing. The 52-week low stands at ₹525.50, which means the current price is 78.00% above that mark.

    For readers tracking the CG Power and Industrial Solutions Ltd share price through the morning session, the current quote reflects a strong start relative to the previous close, with the stock holding near the top of its range. The session’s opening print at ₹938.90 and the early low of ₹882.00 also show that the counter has already tested both ends of a fairly broad band.

    That range is important for live market reading because it captures how quickly the stock has moved in early trade. The current price of ₹937.00 remains close to the opening and the high so far.

    No Immediate Company-Specific Announcement

    No immediate company-specific announcement was available on NSE/BSE at the time of writing. The available exchange-linked information reviewed did not show a fresh disclosure connected to the move, and no recent exchange filing was found in the exchange-linked information reviewed that could be directly connected to the change in price. That means the morning move has to be read through the live market tape rather than a new corporate update.

    For now, the key visible markers are the 7.00% rise, the ₹937.00 price point, the ₹938.90 high so far, the ₹882.00 low so far and the 92,58,467 shares traded. Those figures frame the current market activity without adding any unsupported explanation.

    CG Power and Industrial Solutions Ltd Company Background

    CG Power and Industrial Solutions Ltd is listed on NSE under the symbol CGPOWER. The exchange-linked market data places its market capitalisation at ₹1,46,785.99 crore, with 62,67,50,016 shares outstanding. The supplied market snapshot also shows a PE ratio of 121.94 and EPS of 7.7. For live tracking, those are the main company-level reference points available in the current market update, alongside the share price, trading volumes and range data.

    Conclusion

    CG Power and Industrial Solutions Ltd share price is trading higher in early market activity, with the counter near its session high and volumes running above the average volume supplied. No immediate company-specific announcement was available on NSE/BSE, so investors may track further exchange filings, company disclosures, volume trends and market updates through the session.

  • Market Activity; Siemens Ltd Shares Rise 6%

    Market Activity; Siemens Ltd Shares Rise 6%

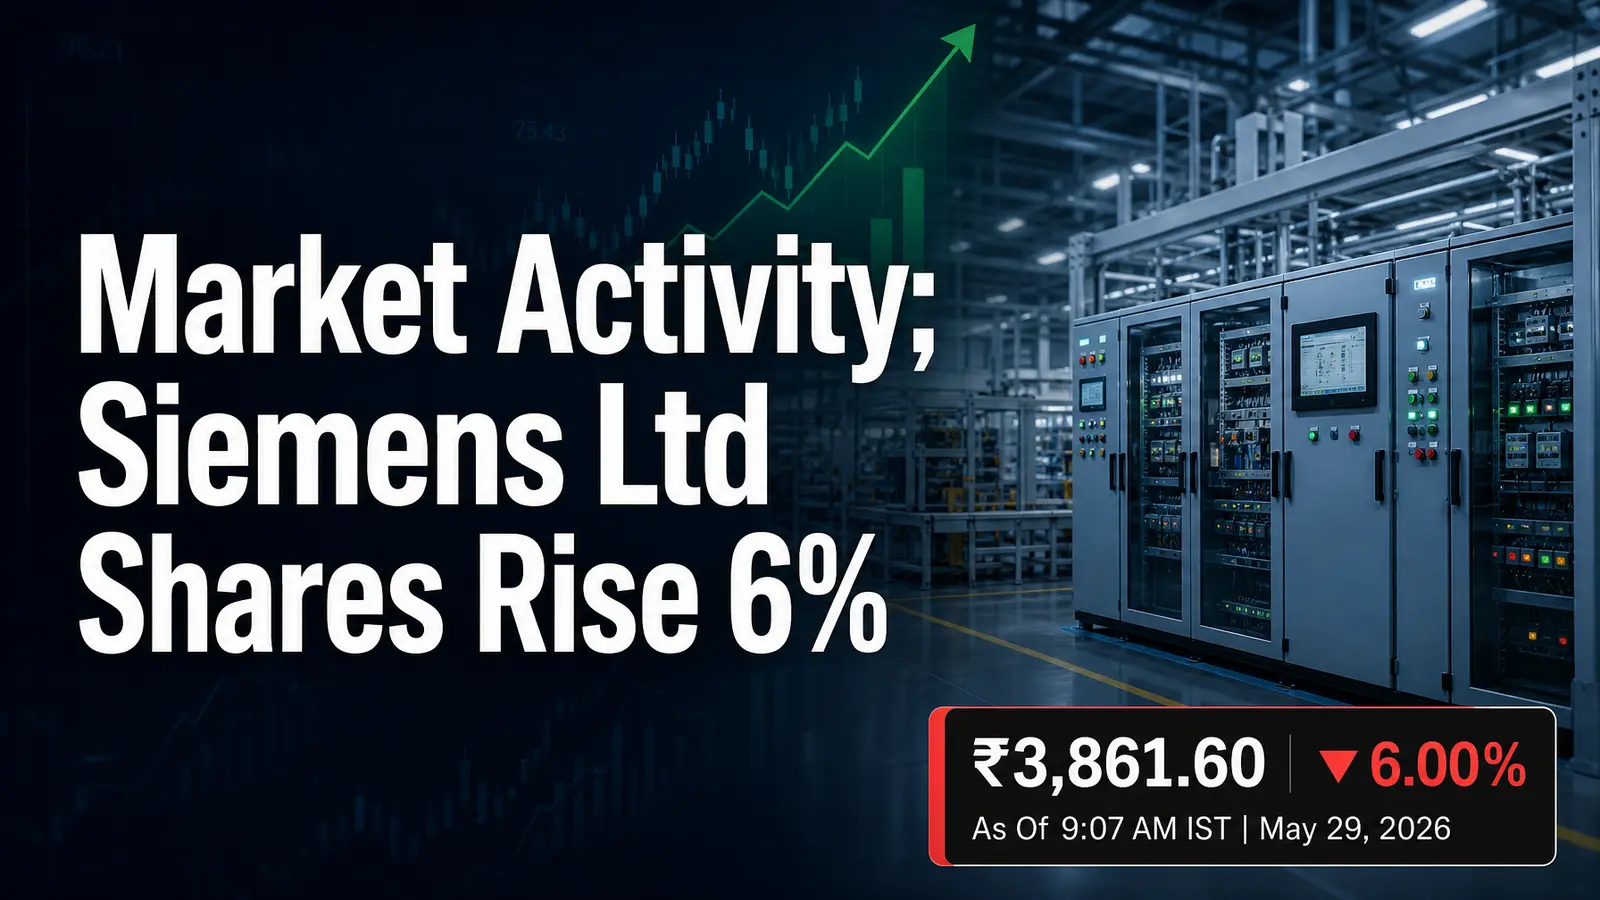
    Mumbai, May 29: Siemens Ltd shares were trading higher at ₹3,861.60 on NSE as of 9:07 AM IST on May 29, 2026, even as No immediate company-specific announcement was available on NSE/BSE at the time of writing. The Siemens Ltd share price was up 6.00% against the previous close of ₹3,677.20, and the counter was active in early market activity under the symbol SIEMENS. The move came during trade on NSE, with the stock moving within a narrow band after the open and before broader session cues had fully formed.

    Siemens Ltd Share Price Movement

    Siemens Ltd shares were trading at ₹3,861.60 on NSE as of 9:07 AM IST on May 29, 2026, compared with the previous close of ₹3,677.20. So far in the session, the stock touched a high of ₹3,909.90 and a low of ₹3,859.70. The counter opened at ₹3,569.70, which left the stock well above its opening print and close to the upper end of the range seen so far.

    Trading volumes stood at 4,356 shares, according to NSE data, while the average volume was 5,45,318 shares and relative volume was 0.01. That points to early market activity that was still light versus the usual pace, even though the Siemens Ltd share price was holding at a firm level. The company’s market capitalisation stood at ₹1,37,519.53 crore, with 35,61,20,256 shares outstanding.

    On the numbers available, the stock was trading just below its 52-week high of ₹3,930 and comfortably above its 52-week low of ₹2,826.

    Recent Siemens Ltd Stock Performance

    The latest move leaves Siemens Ltd close to its 52-week high, with the stock just 2.00% below that level. At the same time, it remains 37.00% above its 52-week low, which gives a clear sense of where the counter sits in the broader range.

    That positioning matters for readers tracking the Siemens Ltd share price during market hours, because the stock is now trading near the top of its 12-month band rather than in the lower half of it. The session data also shows a wide gap between the open at ₹3,569.70 and the high so far at ₹3,909.90.

    Even with low trading volumes of 4,356 shares at this stage, the price action has stayed elevated compared with the previous close of ₹3,677.20.

    No Immediate Company-Specific Announcement

    No immediate company-specific announcement was available on NSE/BSE at the time of writing. The available exchange-linked information did not show a fresh disclosure connected to the move, and no recent exchange filing was found in the exchange-linked information reviewed that could be directly connected to the change in the Siemens Ltd share price. That makes the current market activity a price-led update rather than a disclosure-led one.

    For now, the live screen shows a higher quote, a session high of ₹3,909.90 and a low so far of ₹3,859.70, but no public announcement in the exchange-linked material reviewed that explains the move.

    Siemens Ltd Company Background

    Siemens Ltd is listed on NSE under the symbol SIEMENS. The stock’s market capitalisation stands at ₹1,37,519.53 crore, with 35,61,20,256 shares outstanding, a PE ratio of 77.69 and EPS of 49.68. For market readers, those figures provide the basic reference frame around the Siemens Ltd share price during the session. The stock is trading on NSE, and the live quote data places it near the upper end of its 52-week range as of 9:07 AM IST on May 29, 2026.

    Conclusion

    Siemens Ltd remained in focus on NSE in early trade, with the share price up 6.00% at ₹3,861.60 and no immediate company-specific announcement available on NSE/BSE. Investors may track further exchange filings, company disclosures, trading volumes and market updates as the session progresses.

  • Market Activity; Tata Motors Passenger Vhcls Ltd Shares Rise 5%

    Market Activity; Tata Motors Passenger Vhcls Ltd Shares Rise 5%

    Mumbai, May 29: Tata Motors Passenger Vhcls Ltd shares were trading higher at ₹403.05 on NSE as of 9:16 AM IST on May 29, 2026, even as No immediate company-specific announcement was available on NSE/BSE at the time of writing. The TMPV counter was up 5.00% from the previous close of ₹385.60, and market activity remained active in early trade.

    The Tata Motors Passenger Vhcls Ltd share price moved within a wide band during the session, with the stock touching ₹408.00 at its high so far and ₹383.70 at its low so far.

    Tata Motors Passenger Vhcls Ltd Share Price Movement

    Tata Motors Passenger Vhcls Ltd shares were trading at ₹403.05 on NSE as of 9:16 AM IST on May 29, 2026, compared with the previous close of ₹385.60. The counter opened at ₹400.95, which placed the stock above the previous close from the start of the session. So far in the session, the stock touched a high of ₹408.00 and a low of ₹383.70, showing a fairly broad range during trade.

    Trading volumes stood at 1,24,071 shares, while the relative volume was 0.01 against the average volume of 1,01,92,512 shares. The market capitalisation stood at ₹1,47,647.30 crore. On the current quote, the Tata Motors Passenger Vhcls Ltd share price was ₹17.45 above the previous close, and the move was visible even without any fresh exchange-linked disclosure attached to the session.

    Recent Tata Motors Passenger Vhcls Ltd Stock Performance

    The stock was trading 4.00% below its 52-week high of ₹419.00 and 37.00% above its 52-week low of ₹294.30. That positioning gives a quick reference for where the current level sits within the broader yearly range, even as the live move is being driven by market activity in the morning session.

    For now, the Tata Motors Passenger Vhcls Ltd share price is being tracked mainly through the live quote, the range between ₹383.70 and ₹408.00, and the early volume print of 1,24,071 shares. No five-day, one-week or one-month performance data was supplied, so the current update stays with the exchange-traded numbers available at this stage.

    No Immediate Company-Specific Announcement

    No immediate company-specific announcement was available on NSE/BSE at the time of writing. The available exchange-linked information did not show a fresh disclosure connected to the move, and no recent exchange filing was found in the exchange-linked information reviewed that could be directly connected to the change in the Tata Motors Passenger Vhcls Ltd share price. That leaves the morning move to be read through the live market print alone.

    The stock was higher by ₹17.45 from the previous close, but the exchange-linked record reviewed here did not carry a new announcement, filing or disclosure that could be tied to the session’s market activity. The focus therefore remains on price, range and trading volumes.

    Tata Motors Passenger Vhcls Ltd Company Background

    Tata Motors Passenger Vhcls Ltd is listed on NSE under the symbol TMPV. The company’s market capitalisation stood at ₹1,47,647.30 crore in the latest market snapshot supplied for this update. No shares count, PE ratio or EPS figure was supplied in the current market data, so this background stays limited to the listing and valuation marker available.

    For live market readers, the Tata Motors Passenger Vhcls Ltd share price and the TMPV counter are the main references available in the exchange snapshot reviewed at 9:16 AM IST on May 29, 2026.

    Conclusion

    TMPV remained in focus in early trade with a 5.00% rise, a ₹403.05 quote on NSE, and a session range that stretched from ₹383.70 to ₹408.00. Investors may track further exchange filings, company disclosures, volume trends and market updates for any additional context as the session progresses.

  • Market Activity; Adani Energy Solutions Ltd Shares Rise 6%

    Market Activity; Adani Energy Solutions Ltd Shares Rise 6%

    Mumbai, May 29: Adani Energy Solutions Ltd shares were trading higher at ₹1,546.00 on NSE as of 9:16 AM IST on May 29, 2026, even as No immediate company-specific announcement was available on NSE/BSE at the time of writing. The stock, under symbol ADANIENSOL, was up 6.00% compared with the previous close of ₹1,463.30, and market activity remained active in early trade.

    The Adani Energy Solutions Ltd share price was moving in a wide range during the morning session, with trading volumes and price action both drawing attention from the market.

    Adani Energy Solutions Ltd Share Price Movement

    Adani Energy Solutions Ltd shares were trading at ₹1,546.00 on NSE as of 9:16 AM IST on May 29, 2026, compared with the previous close of ₹1,463.30. So far in the session, the stock touched a high of ₹1,557.10 and a low of ₹1,475.10. The counter opened at ₹1,557.10 and then slipped below that level during trade, even though it remained above the previous close.

    Trading volumes stood at 15,466, according to NSE data, against an average volume of 39,66,522, while relative volume was shown at 0. The company’s market capitalisation stood at ₹1,85,830.78 crore, with the stock trading at 82.35 times PE and EPS of 19. The Adani Energy Solutions Ltd share price therefore reflected a firm start, followed by a pullback from the session peak.

    The gap between the high so far of ₹1,557.10 and the low so far of ₹1,475.10 shows that the counter was moving within a broad range during the morning session.

    Recent Adani Energy Solutions Ltd Stock Performance

    The stock was trading just below its 52-week high of ₹1,571.70, placing it about 2.00% away from that level. At the same time, it was well above the 52-week low of ₹744.90, which puts the counter 1.08% above that mark on the supplied scale. That positioning matters for readers tracking the Adani Energy Solutions Ltd share price during market hours.

    With the stock at ₹1,546.00 and the high so far at ₹1,557.10, the scrip was trading close to the upper end of its yearly range even after easing from the opening level. The current move also left it above the previous close by ₹82.70.

    No Immediate Company-Specific Announcement

    No immediate company-specific announcement was available on NSE/BSE at the time of writing. The available exchange-linked information did not show a fresh disclosure connected to the move, and no recent exchange filing was found in the exchange-linked information reviewed that could be directly connected to the move. That makes the morning action a stock-specific price move without a clear corporate trigger in the material reviewed so far.

    For now, the focus stays on the live quote, the range between the high so far and low so far, and the trading volumes reported by NSE. The absence of a fresh filing should not be read as a cause for the move.

    Adani Energy Solutions Ltd Company Background

    Adani Energy Solutions Ltd is listed on NSE under the symbol ADANIENSOL. Based on the supplied market snapshot, the company had a market capitalisation of ₹1,85,830.78 crore, with PE at 82.35 and EPS at 19. For readers tracking the Adani Energy Solutions Ltd share price, these are the key reference points available in the current market update. The stock’s live quote, session range and volume are the main data anchors available at 9:16 AM IST on May 29, 2026, along with the exchange context from NSE.

    Conclusion

    Adani Energy Solutions Ltd remained higher in morning trade, with the Adani Energy Solutions Ltd share price at ₹1,546.00 and the stock up 6.00% on NSE as of 9:16 AM IST on May 29, 2026. Investors may track further exchange filings, company disclosures, volume trends and market updates through the session.

  • Market Activity; ICICI Prudential Asset Management Co Ltd Shares Rise 4%

    Market Activity; ICICI Prudential Asset Management Co Ltd Shares Rise 4%

    Mumbai, May 29: ICICI Prudential Asset Management Co Ltd shares were trading higher at ₹3,482.50 on NSE as of 9:07 AM IST on May 29, 2026, even as No immediate company-specific announcement was available on NSE/BSE at the time of writing. The ICICIAMC counter was up 4.00% from the previous close of ₹3,360.60, and market activity was already active in early trade. The stock moved within a fairly tight band so far in the session, with the latest print coming after a higher opening and above-average trading volumes.

    ICICI Prudential Asset Management Co Ltd Share Price Movement

    ICICI Prudential Asset Management Co Ltd shares were trading at ₹3,482.50 on NSE as of 9:07 AM IST on May 29, 2026, compared with the previous close of ₹3,360.60. So far in the session, the stock touched a high so far of ₹3,504.70 and a low so far of ₹3,450.00, while the counter opened at ₹3,343.00. Trading volumes stood at 672,004, against an average volume of 298,447, giving a relative volume of 2.25.

    The company’s market capitalisation stood at ₹1,68,218.47 crore, and the share price was holding well above the previous close during trade. The ICICI Prudential Asset Management Co Ltd share price was therefore trading with a gain of ₹121.90 over the previous close at the time of the update. The move also left the stock just below its session peak, with the high so far at ₹3,504.70 and the low so far at ₹3,450.00.

    That range suggests the counter has stayed near the upper end of its morning band, with trading volumes already more than double the average volume. The market cap figure of ₹1,68,218.47 crore provides the latest size marker for the counter on NSE.

    Recent ICICI Prudential Asset Management Co Ltd Stock Performance

    The latest move leaves ICICI Prudential Asset Management Co Ltd share price close to its 52-week high of ₹3,597.50. At ₹3,482.50, the stock was about 3.00% below that peak, while it remained 38.00% above the 52-week low of ₹2,530.00. That positioning places the scrip in the upper part of its one-year range, even as the current session was still in progress.

    The stock’s early trade pattern also showed a stronger opening at ₹3,343.00 before moving to ₹3,504.70 at the high so far. With 672,004 shares changing hands by 9:07 AM IST, the ICICI Prudential Asset Management Co Ltd share price was already drawing heavier market activity than the average volume of 298,447.

    No Immediate Company-Specific Announcement

    At the time of writing, no immediate company-specific announcement was available on NSE/BSE. The available exchange-linked information did not show a fresh disclosure connected to the move, and no recent exchange filing was found in the exchange-linked information reviewed that could be directly connected to the share price action.

    That means the morning move has to be read strictly through the live market print, the session range and the trading volumes, rather than through any verified corporate trigger. The stock was higher by 4.00% as of 9:07 AM IST on May 29, 2026, but the exchange-linked information reviewed did not add any new company event to explain the move.

    For now, the cleanest facts remain the price, the range and the volume count of 672,004.

    ICICI Prudential Asset Management Co Ltd Company Background

    ICICI Prudential Asset Management Co Ltd is listed on NSE under the symbol ICICIAMC. The stock’s current market capitalisation stands at ₹1,68,218.47 crore, with a PE ratio of 51.7 and EPS of 66.73 based on the figures supplied for this update. For readers tracking the ICICI Prudential Asset Management Co Ltd share price, these are the core listed-market identifiers available in the current session snapshot.

    The company background in this update is limited to the exchange listing, market capitalisation, PE and EPS, with no additional operating description supplied in the exchange-linked information reviewed.

    Conclusion

    ICICI Prudential Asset Management Co Ltd remained firmly higher in early NSE trade, with the share price at ₹3,482.50, up 4.00%, and volumes already above the average. With no immediate company-specific announcement available on NSE/BSE, investors may track further exchange filings, company disclosures, volume trends and market updates through the session.

  • Audited FY26 Results Filed; Schneider Electric Infrastructure Ltd Shares Fall 5%

    Audited FY26 Results Filed; Schneider Electric Infrastructure Ltd Shares Fall 5%

    Mumbai, May 29: Schneider Electric Infrastructure Ltd shares were trading lower at ₹1,370.10 on NSE as of 9:16 AM IST on May 29, 2026. The stock was down 5.00% and the company disclosed a company update in an exchange filing. The move came alongside the verified company-specific update, with the counter trading below its previous close of ₹1,376.80. The scrip, identified by symbol SCHNEIDER, was in focus during market hours as the filing and the live price snapshot came through together.

    What Schneider Electric Infrastructure Ltd Announced

    Schneider Electric Infrastructure Ltd informed the exchange about its audited financial results for the fourth quarter and financial year ended March 31, 2026. The board had approved the results at its meeting held on May 28, 2026, and the filing was made on May 29, 2026. The company reported sales of ₹2,891 crore for FY26, up 9.6% year on year, and orders of ₹3,430 crore, up 27.4% year on year.

    Profit before tax stood at ₹292 crore, down 16.8% from the previous year. For Q4 FY26, sales came in at ₹590 crore, up 0.5% year on year, while profit after tax was ₹22 crore, down 59.8% year on year. The filing also noted exceptional items that affected profitability in the year and the quarter. These included a gratuity liability adjustment and reversal of interest provisions related to past direct tax litigation.

    The company’s investor conference call presentation was enclosed with the exchange filing.

    Schneider Electric Infrastructure Ltd Share Price Movement

    Schneider Electric Infrastructure Ltd shares were trading at ₹1,370.10 on NSE as of 9:16 AM IST on May 29, 2026, compared with its previous close of ₹1,376.80. So far in the session, the stock touched a high of ₹1,417.80 and a low of ₹1,308.80. The Schneider Electric Infrastructure Ltd share price movement was recorded during day’s trade. The counter opened at ₹1,396.90 and was lower by ₹6.70, or 5.00%, at the latest reading.

    Volume stood at 2,866 shares against an average volume of 212,431 shares, leaving relative volume at 0.01. That shows activity was still thin at the time of the snapshot, even though the stock had already moved through a wide range. The stock touched its 52-week high of ₹1,417.80 in the same session, which also matches the 52-week peak supplied for the scrip. Its 52-week low is ₹571.85.

    On the market-cap side, the company was valued at ₹31,293.93 crore, with 23.91 crore shares outstanding, a PE ratio of 127.64 and EPS of 10.25. For readers tracking the Schneider Electric Infrastructure Ltd share price, the live move has to be read with the exchange filing and the session range together. The stock was trading well below the opening level, but still near the day’s top band after briefly testing ₹1,417.80.

    The low so far at ₹1,308.80 marked the widest downside point seen during the morning session.

    Schneider Electric Infrastructure Ltd Company Background

    Schneider Electric Infrastructure Ltd is listed on NSE under the symbol SCHNEIDER. The company’s market capitalisation stood at ₹31,293.93 crore in the latest snapshot, with 239,104,032 shares outstanding. The stock was trading at a PE ratio of 127.64 and EPS of 10.25. These figures provide the basic listed-company context available in the market snapshot, alongside the live price and exchange filing reference.

    Conclusion

    The company-specific disclosure placed Schneider Electric Infrastructure Ltd in focus during market hours, while the share price stayed under pressure in early trade. Investors may track further exchange filings, regulatory updates, board decisions or market disclosures for additional company-specific information.

  • Audited FY26 Results Approved; Simplex Infrastructures Ltd Shares Fall 3%

    Audited FY26 Results Approved; Simplex Infrastructures Ltd Shares Fall 3%

    Mumbai, May 29: Simplex Infrastructures Ltd shares were trading lower at ₹253.26 on NSE as of 9:57 AM IST on May 29, 2026. The company disclosed company update in an exchange filing. The SIMPLEXINF counter was down 3.00% and was compared with its previous close of ₹260.67. The verified company-specific update placed the stock in focus during market hours, while the live price action showed the scrip moving between ₹260.67 and ₹250.59 so far in the session.

    What Simplex Infrastructures Ltd Announced

    The company informed the exchange that its Board met on 28 May 2026 and approved the audited standalone and consolidated financial results for the quarter and year ended 31 March 2026. The filing also recorded the statutory auditors’ report, with an unmodified audit opinion, and noted approval of the Board’s report and AGM notice for 23 September 2026. Alongside the results, the company disclosed a few other board-level items. These included the re-appointment of M/s.

    Mukesh Kumar & Associates as Cost Auditors for FY 2026-27 and the note that the company entered into a Master Restructuring Agreement with NARCL for debt restructuring. The filing also set out disclosures on exceptional items, fund-raising, debt and defaults. The announcement said the preferential issue and convertible warrants together raised ₹281.59 crore.

    It also stated that outstanding debt as on 31 March 2026 stood at ₹165,553 lakh, while the amount of default on loans was ₹4,616 lakh. The exchange filing showed these were part of the audited financial results package approved by the board. The disclosure is the main verified event for the session, and it is the latest company-specific update available to the market during trade.

    Simplex Infrastructures Ltd Share Price Movement

    Simplex Infrastructures Ltd shares were trading at ₹253.26 on NSE as of 9:57 AM IST on May 29, 2026, compared with its previous close of ₹260.67. So far in the session, the stock touched a high of ₹260.67 and a low of ₹250.59. The Simplex Infrastructures Ltd share price movement was recorded during day’s trade.

    The counter opened at ₹260.67, which was also the day’s high so far at the time of the snapshot, and then slipped to the session low of ₹250.59 before recovering slightly to the quoted level. The move left the stock ₹7.41 lower in absolute terms, equal to a 3.00% decline. Volume stood at 75,623 shares, against an average volume of 125,519 shares, putting relative volume at 0.6.

    That means activity was below the average volume level at the time of the update, even as the stock remained in focus after the exchange filing. The stock touched ₹260.67 on the upside and ₹250.59 on the downside during trade, giving it a narrow early range of ₹10.08.

    The Simplex Infrastructures Ltd share price also needs to be read against its 52-week band: the counter is 23.00% below its 52-week high of ₹330 and 85.00% above its 52-week low of ₹137. Market capitalisation stood at ₹2,003.17 crore, with 5,65,40,820 shares outstanding. The stock’s PE ratio was 24.64 and EPS was 10.29 at the time of the market snapshot.

    Simplex Infrastructures Ltd Company Background

    Simplex Infrastructures Ltd is listed on NSE under the symbol SIMPLEXINF. In the market snapshot used for this update, the company had a market capitalisation of ₹2,003.17 crore, 5,65,40,820 shares outstanding, a PE ratio of 24.64 and EPS of 10.29. Those are the key public markers available in the live market record for the counter. The stock is tracked on NSE as SIMPLEXINF, and the current session’s move is being read alongside the audited results disclosure and board approvals filed with the exchange.

    Conclusion

    The stock remained lower during morning trade as the company’s audited FY26 results and related board decisions were filed with the exchange. Investors may track further exchange filings, regulatory updates, board decisions or market disclosures for more detail on the company’s reported numbers and corporate actions.

  • Update; Antarctica Ltd Shares Fall 4%

    Update; Antarctica Ltd Shares Fall 4%

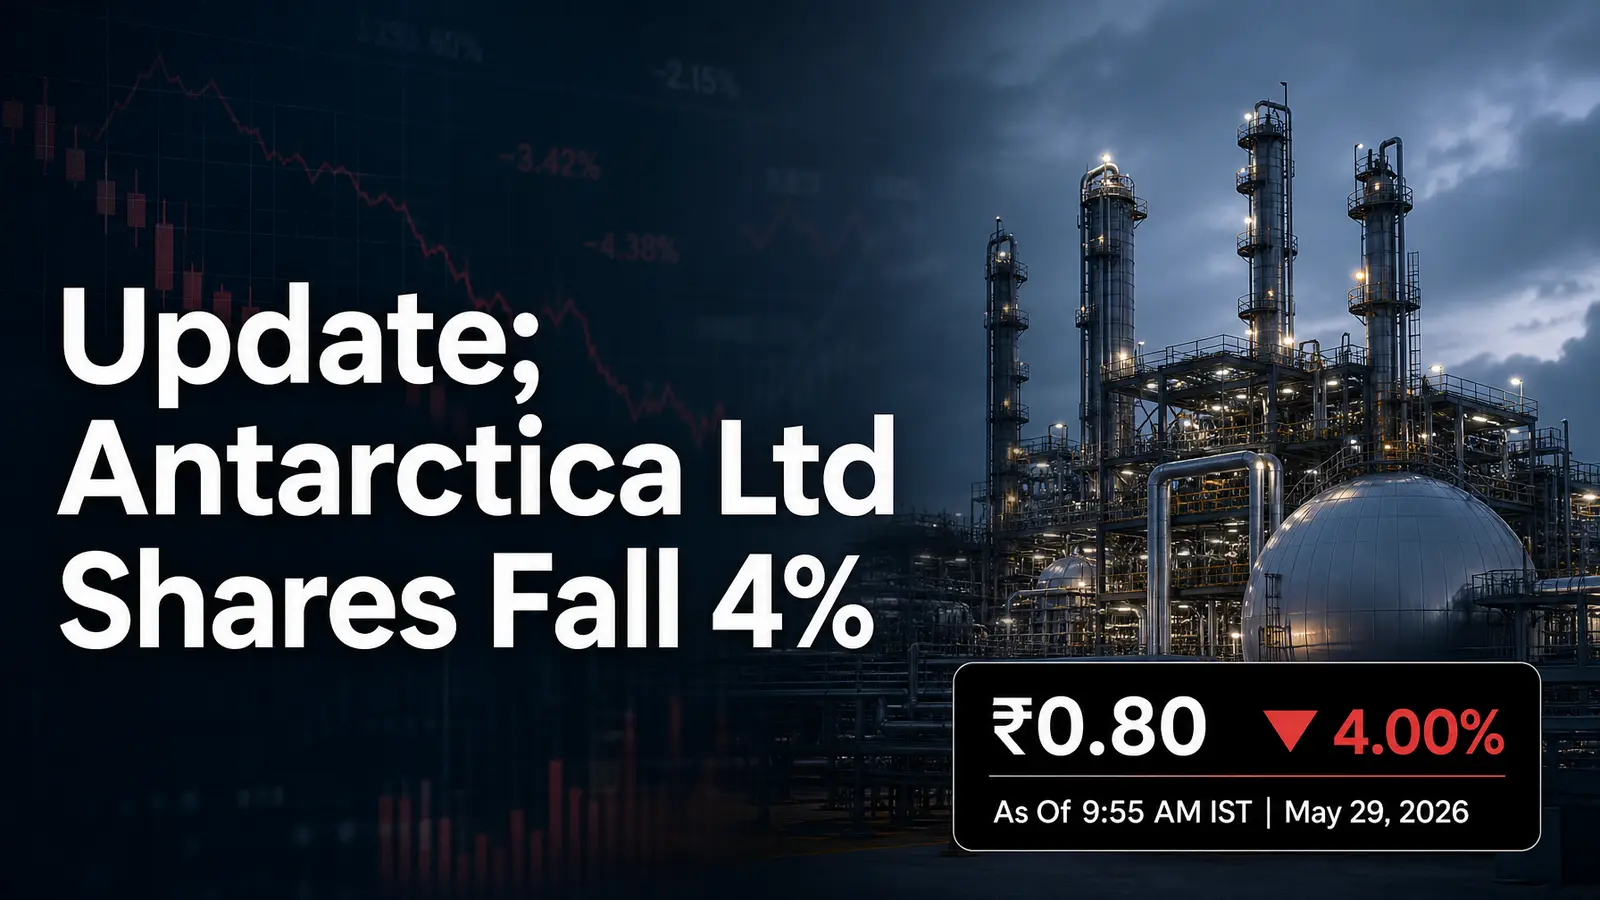
    Mumbai, May 29: Antarctica Ltd shares were trading lower at ₹0.80 on NSE as of 9:55 AM IST on May 29, 2026. The company disclosed company update in an exchange filing. The ANTGRAPHIC counter was down 4.00% from its previous close of ₹0.83, and the stock was in focus during market hours alongside the verified company-specific update.

    The latest price snapshot also showed the scrip moving within a narrow band so far in the session, with the stock touching ₹0.84 at the high so far and ₹0.80 at the low so far during day’s trade.

    What Antarctica Ltd Announced

    Antarctica Ltd informed the exchange that the meeting of its Board of Directors, which was scheduled to be held on Friday, 28th May, 2026, has been postponed to 30th May, 2026. The disclosure was made through an exchange filing dated 28 May 2026, and the company did not attach any financial result, corporate action, order value or other material business update to the note. The filing is limited to the change in board meeting timing.

    No board decision, approval, record date, ex-date, dividend, bonus issue, split, or fund-raising detail was included in the communication. The exchange filing showed only that the scheduled meeting has been moved, keeping the update specific and routine in nature. For investors tracking Antarctica Ltd share price moves, the only verified trigger available in the current filing is the postponement itself.

    The company-specific disclosure placed the stock in focus during market hours, but the document does not state any link between the filing and the live price move. The note also does not provide any additional timeline beyond the revised date of 30th May, 2026.

    Antarctica Ltd Share Price Movement

    Antarctica Ltd shares were trading at ₹0.80 on NSE as of 9:55 AM IST on May 29, 2026, compared with its previous close of ₹0.83. So far in the session, the stock touched a high of ₹0.84 and a low of ₹0.80. The Antarctica Ltd share price movement was recorded during day’s trade, with the counter opening at ₹0.83 and then slipping below the previous close as the session progressed.

    Volume stood at 1,00,396 shares, against an average volume of 2,36,609 shares, putting relative volume at 0.42. That means turnover in the first part of trade was below the average pace seen in the stock snapshot, even as the stock stayed active around the ₹0.80 to ₹0.84 range.

    The move of ₹0.03 lower from the previous close also left the counter 51.00% below its 52-week high of ₹1.62, while it remained 25.00% above the 52-week low of ₹0.64. The market capitalisation stood at ₹12.40 crore, with 12,03,09,600 shares outstanding. On the stock snapshot, the stock showed a PE ratio of 6.21 and EPS of 0.13.

    Those figures give a compact view of the scrip’s current market profile while the live price stayed pinned near the lower end of the session range. The open at ₹0.83 matched the previous close, but the counter quickly moved to ₹0.80, where it was last seen. For investors following the Antarctica Ltd share price, the immediate focus remains the live range, volume and the exchange filing that confirmed the board meeting postponement.

    Antarctica Ltd Company Background

    Antarctica Ltd trades on NSE under the symbol ANTGRAPHIC. Based on the supplied market snapshot, the company has a market capitalisation of ₹12.40 crore, 12,03,09,600 shares outstanding, a PE ratio of 6.21 and EPS of 0.13. The current article data does not provide a business description, segment detail or operating profile, so the background is limited to the listed identity and market statistics available in the exchange-linked snapshot.

    The stock’s 52-week range of ₹0.64 to ₹1.62 also places the current quote within a wider band that investors can track alongside further filings.

    Conclusion

    Antarctica Ltd remains in focus during market hours after the company informed the exchange about the postponement of its board meeting to 30th May, 2026. Investors may track further exchange filings, regulatory updates, board decisions or market disclosures for any fresh company-specific detail.

  • Update; Asian Hotels (East) Ltd Shares Rise 3%

    Update; Asian Hotels (East) Ltd Shares Rise 3%

    Mumbai, May 29: Asian Hotels (East) Ltd shares were trading higher at ₹165.80 on NSE as of 9:47 AM IST on May 29, 2026. The stock was up 3.00% and the company disclosed company update in an exchange filing. The move came alongside the verified company-specific update, with AHLEAST quoted against its previous close of ₹161.67.

    What Asian Hotels (East) Ltd Announced

    The company informed the exchange that its Board Meeting, which was originally scheduled for 28th May, 2026, has been rescheduled to Saturday, 30th May, 2026. According to the filing, the agenda items for the meeting remain the same as previously intimated, and the change was attributed to unforeseen and unavoidable circumstances.

    The same exchange communication also said the trading window shall remain closed till 48 hours after the declaration of the financial results, in line with SEBI (PIT) Regulations, 2015 and the company’s Code of Conduct. That is the only fresh corporate update available in the filing, and it is the verified backdrop for the live-market article.

    The company-specific disclosure placed the stock in focus during market hours, but the filing itself is routine in nature and does not provide any new business, financial or operational numbers. The exchange filing showed only the revised meeting date, the unchanged agenda, and the trading window note. Source detail: https://nsearchives. nseindia. com/corporate/AHLEAST_28052026201934_Intimation. pdf

    Asian Hotels (East) Ltd Share Price Movement

    Asian Hotels (East) Ltd shares were trading at ₹165.80 on NSE as of 9:47 AM IST on May 29, 2026, compared with its previous close of ₹161.67. So far in the session, the stock touched a high of ₹165.80 and a low of ₹162.11. The Asian Hotels (East) Ltd share price movement was recorded during day’s trade.

    The counter opened at ₹162.11 and held at the same level as its low so far, before moving to the session high of ₹165.80. The stock was up ₹4.13 from the previous close, with volume at 816 shares against an average volume of 6,625, leaving relative volume at 0.12. That places the early-session turnover below the average pace, even as the price held near the top of the day’s range.

    The stock touched ₹165.80 in the morning session, and the spread between the open and the high so far was ₹3.69. The Asian Hotels (East) Ltd share price therefore reflected a firm start, though the traded quantity remained limited at this stage. The scrip is trading 5.00% below its 52-week high of ₹175.3 and 30.00% above its 52-week low of ₹127.25.

    Market capitalisation stood at ₹286.70 crore, based on 11,527,797 shares, while EPS was -32.44 and PE was not available in the snapshot. For live-market readers, the key point is simple: Asian Hotels (East) Ltd share price was higher in morning trade, and the stock was in focus because the company disclosed a board meeting rescheduling and trading window update in an exchange filing.

    Asian Hotels (East) Ltd Company Background

    Asian Hotels (East) Ltd is listed on NSE under the symbol AHLEAST. The stock snapshot supplied for the session shows a market capitalisation of ₹286.70 crore, with 11,527,797 shares outstanding. The available financial markers in the snapshot are limited to EPS of -32.44 and no PE ratio. On the market screen, that leaves the counter to be read mainly through price, volume, and exchange disclosure context rather than through any broader company description.

    Conclusion

    The latest move in Asian Hotels (East) Ltd shares came with a verified exchange filing that rescheduled the Board Meeting to 30th May, 2026 and kept the agenda unchanged. Investors may track further exchange filings, regulatory updates, board decisions or market disclosures for the next company update.